South Africa Flag sign on ECG
South Africa Flag sign on the ECG – a specific ECG pattern that occurs during the development of mid-anterior (high lateral) myocardial infarction (MI) due to occlusion of the first diagonal artery – D1 (a branch of the left anterior descending artery (LAD) of the left coronary artery). The first diagonal artery (D1) supplies a part of the anterior wall of the left ventricle (LV) and lesser its basal anterolateral areas (Fig. 1).
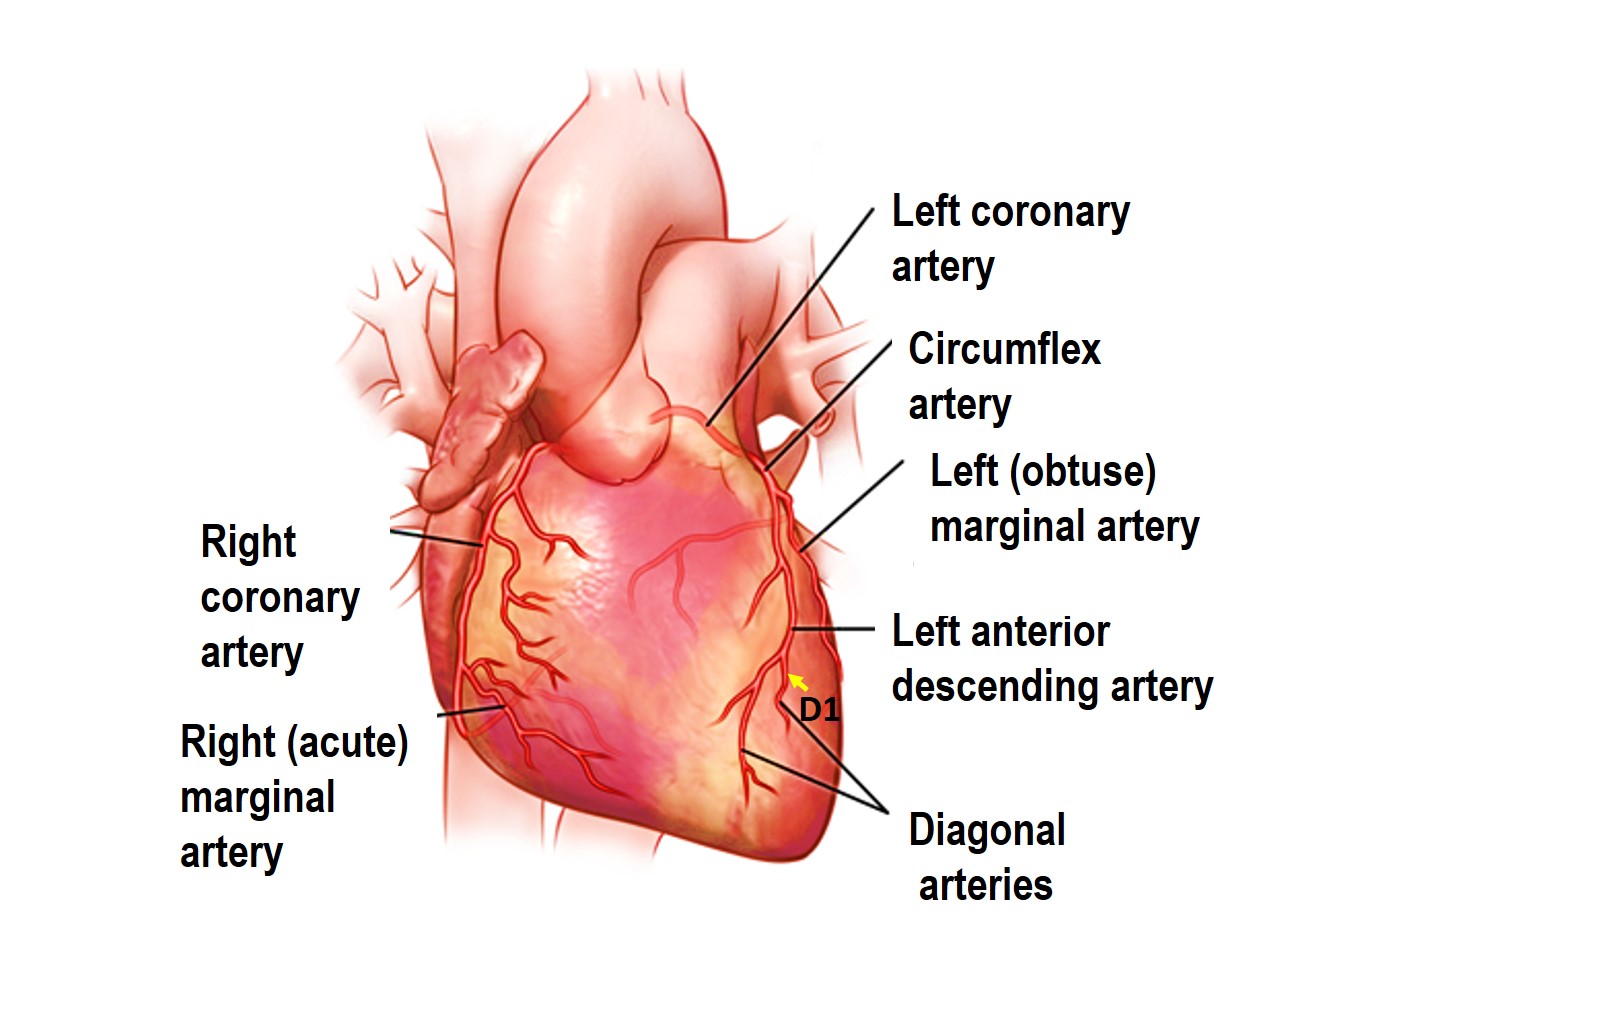
Fig. 1. Coronary arteries. First diagonal artery (D1) (pointer – yellow arrow).
Culprit’s arteries
- Occlusion of the first diagonal branch (D1) of the left anterior descending artery (LAD) can cause isolated ST elevation in I and aVL.
- Occlusion of the left circumflex artery can cause ST-segment elevation in I, aVL along with leads V5-6.
Clinical relevance
Very often, high lateral infarctions (STEMI) are not diagnosed on time even by experienced emergency doctors due to the non-contiguous nature of ST-segment elevation on the electrocardiogram (ECG).
Sign of the South African flag on the ECG
With occlusion of D1 (LAD-D1), on the ECG are revealed the following changes (Fig. 2):
- ST-elevation: leads I, aVL, V2
- ST depression: Leads III (and inferior leads).
ST-elevation is predominantly localized in leads I, aVL +/- V2, but not in other anterior leads.
Reciprocal ST depression and/or T-wave inversion in inferior leads, most pronounced in lead III.
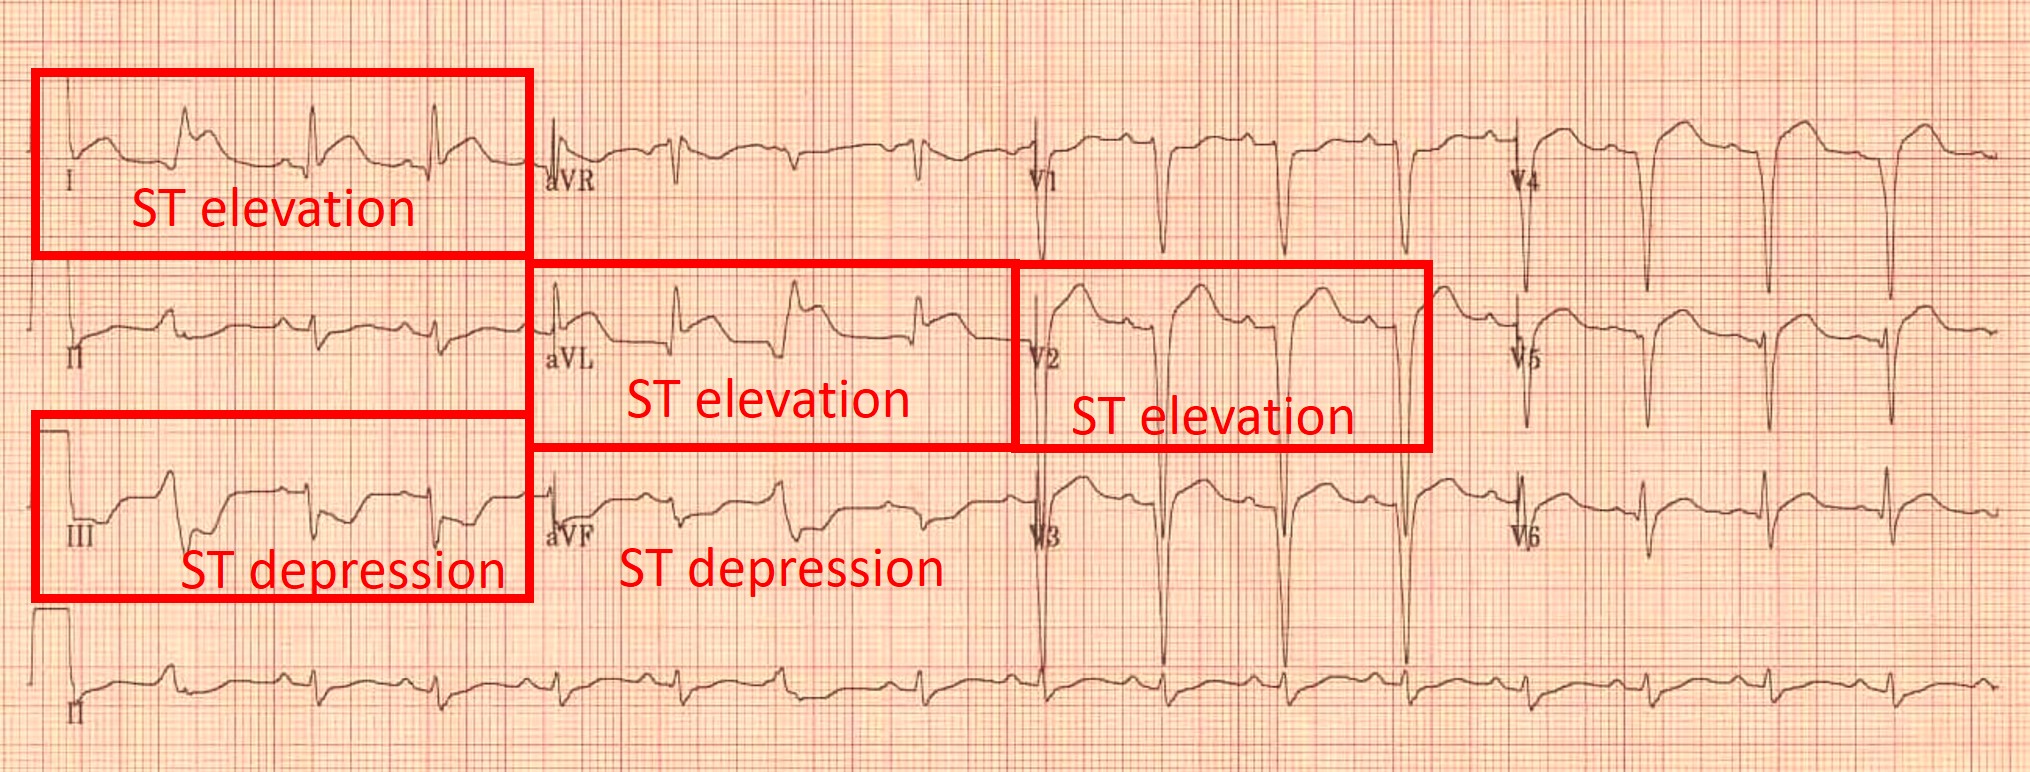
Fig. 2. South Africa Flag sign on ECG (ST Elevation: Leads I, aVL, V2, ST Depression: Leads III (and inferior leads aVF)).
Algorithm for identifying the feature of the “South Africa Flag sign” on the ECG
Littmann L. offers a simple step-by-step algorithm that can help emergency physicians identify the typical ST-segment abnormalities seen in high lateral STEMI.
The author uses a three-step approach:
Step 1: understand the ST vector in high lateral STEMI.
In high lateral infarction, the ST vector is directed towards the armpit and is usually directed from 0 ° to -90 ° in the frontal plane. 6 ECG leads are grouped in this area, which can inherit a high lateral ST vector. 0 ° corresponds to lead I, -30 ° corresponds to aVL, -60 ° corresponds to a mirror image of lead III, and -90 ° corresponds to a mirror image of lead aVF. Located on the left and above the center of the heart, the projection of lead V2 in the frontal plane is also directed towards the armpit. Therefore, the morphology of complexes in V2 often resembles the morphology in lead aVL. Based on Fig. 3, it is easy to recognize why STEMI-D1 is characterized by ST elevation in leads I, aVL, and V2, and ST depression in leads III and aVF.
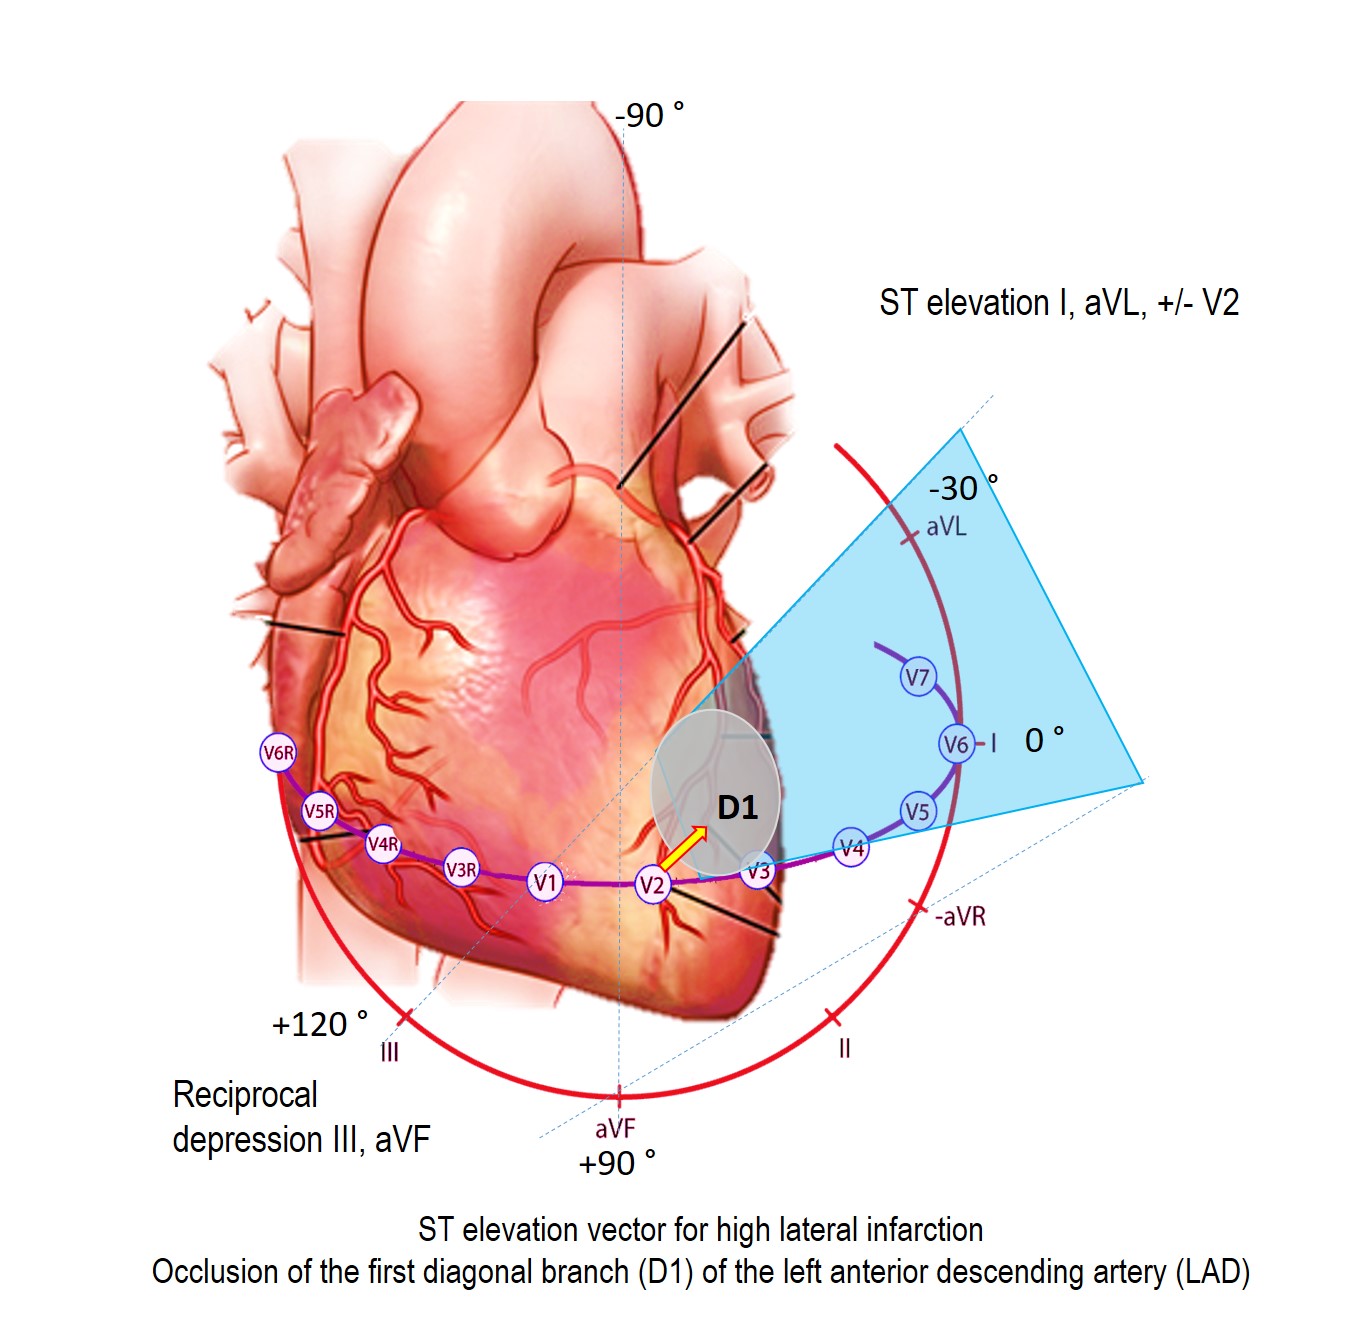
Fig. 3. ST-elevation vector in high lateral myocardial infarction with occlusion of the first diagonal branch (D1) of the left anterior descending artery (LAD) (yellow arrow, blue zone). The ST vector points to leads I, aVL, V2 and forms a mirror image in III and aVF leads.
Therefore, any D1-LAD occlusion causes ST-elevation in lead I, aVL, lead III mirroring, which represents ST depression in lead III and lead V2. Since they are not contiguous in the 4 × 3 12-lead ECG format registration, it is very easy to skip these changes. And since it also causes ST-depression in lead III and aVF, which are adjacent, it is easy to mistake an ST-segment elevation patient for a non-ST-elevated myocardial infarction.
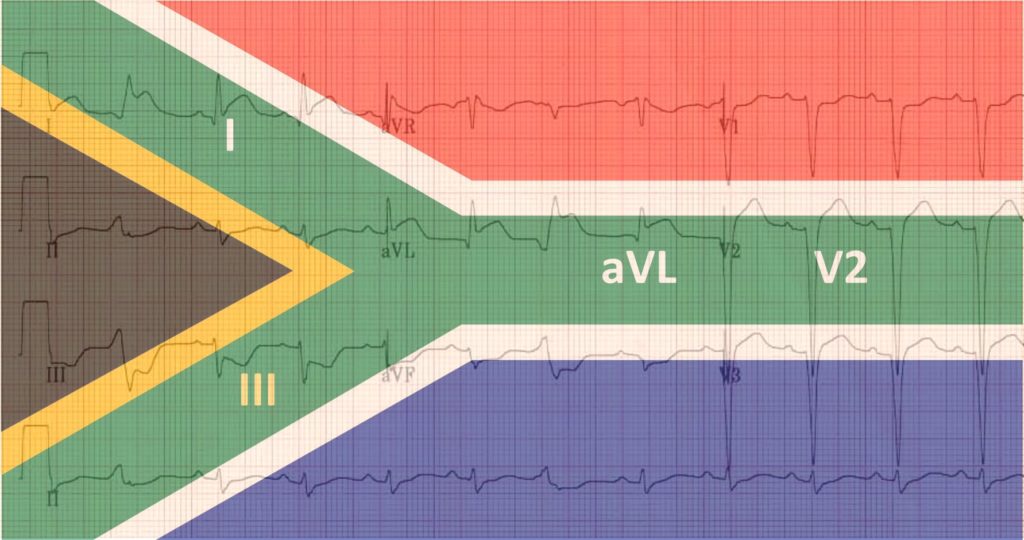
Step 2: recognize the electrocardiographic “South African flag sign”.
Most electrocardiographs record 12-lead ECGs in a 4 × 3 format. With this display, the location of ST-segment deviation resembles the image of the South African flag with ST-elevation in the upper left panel (lead I) and in the two middle panels in the second and third columns (leads aVL and V2, respectively) and ST-depression in the lower-left panel (lead III ).
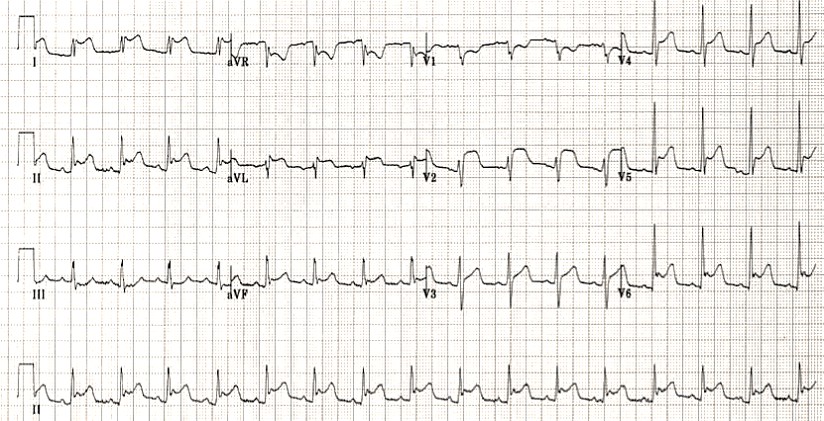
In fig. 4 shows a case where STEMI can be accurately identified and therefore easier to remember the South African flag pattern. It also demonstrates that the prominent ST-elevation seen in V2 should be a frontal plane rather than a horizontal ST vector reflection because there is absolutely no corresponding ST elevation in leads V1 and V3, the two contiguous chest’s leads.

Fig. 4. The South Africa Flag sign on the ECG. In the most common 12-lead 4×3 ECG format, the most significant ST abnormalities resemble the shape of the South African flag.
The South Africa Flag sign on the ECG has a green middle zone that resembles a “Y”. Leads I and III occupy the upper and lower limb Y. Lead aVL occupies the intersection of two limbs Y, and lead V2 unites the upper and lower parts of Y. Thus, all of these leads coincide, and the elevation ST depression in lead I, aVL, V2, and ST depression in lead III match the South African flag. Therefore, to recognize D1-LAD occlusion, Littmann described one specific 12-lead ECG feature called the flag of South Africa. This flag of South Africa can be easily recognized, which can minimize the chances of missing a D1-LAD occlusion.
Step 3: recognize a more subtle high lateral STEMI.
High lateral STEMI is often not diagnosed early because ST depression seen in leads III and aVF is mistaken for inferior ischemia. However, it should be borne in mind that ST depression in any lead can be a reflection of ST elevation in the mirrored leads. Even when ST elevation is quite mild, if it is localized in leads I, aVL, and V2, ST depression in the inferior leads should probably be considered reciprocal (Fig. 5).

Fig. 5. South Africa Flag sign on the ECG.
Conclusions
Identification of the sign of the South African flag on the ECG can improve the timely diagnosis of high lateral myocardial infarctions that are not diagnosed in time due to the non-contiguous nature of ST segment elevation on the electrocardiogram, which will allow timely reperfusion therapy for this group of patients.
Reference
- Durant E., Singh A. Acute first diagonal artery occlusion: a characteristic pattern of ST elevation in noncontiguous leads. Am J Emerg Med. 2015; 33: 1326.e3-5
- Littmann L. South African flag sign: a teaching tool for easier ECG recognition of high lateral infarct. The American Journal of Emergency Medicine. 2016;34(1), P107-109.
- G Rajendran, S Mahalingam, R Kagne, B Nathan, The South African flag sign—an electrocardiographic sign to predict the culprit artery, QJM: An International Journal of Medicine, 2021.
- Monica Monaghan, Shiva Sreenivasa A Red Flag ECG Circulation. 2020;142:1871–1874
Register on our website right now to have access to more learning materials!

Baseline Cardiovascular Risk Assessment in Cancer Patients Scheduled to Receive Cardiotoxic Cancer Therapies (Anthracycline Chemotherapy) – Online Calculator
Baseline cardiovascular risk assessment in cancer patients scheduled to receive cardiotoxic cancer therapies (Anthracycline Chemotherapy)…

SAVED VTE Score
SAVED score for venous thromboembolism risk stratification in patients with multiple myeloma receiving immunomodulators. [ezfc…
IMPEDE VTE Score
IMPEDE score for venous thromboembolism risk stratification in patients with multiple myeloma receiving immunomodulators. [ezfc…
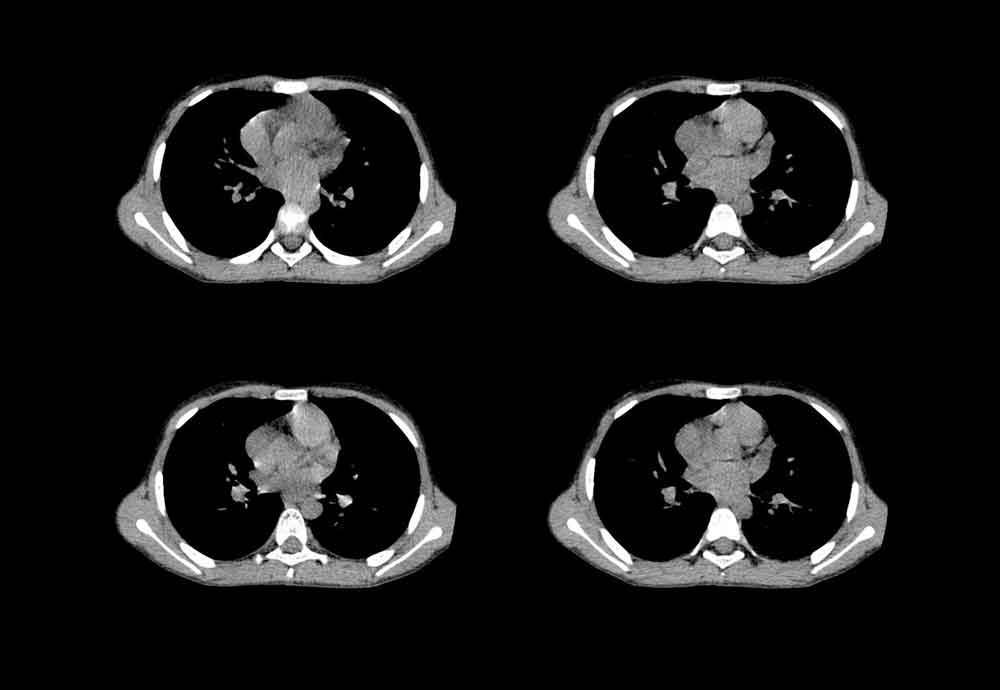
Chest CT Scan
To analyze a CT scan of the chest, imagine that the patient is lying on…
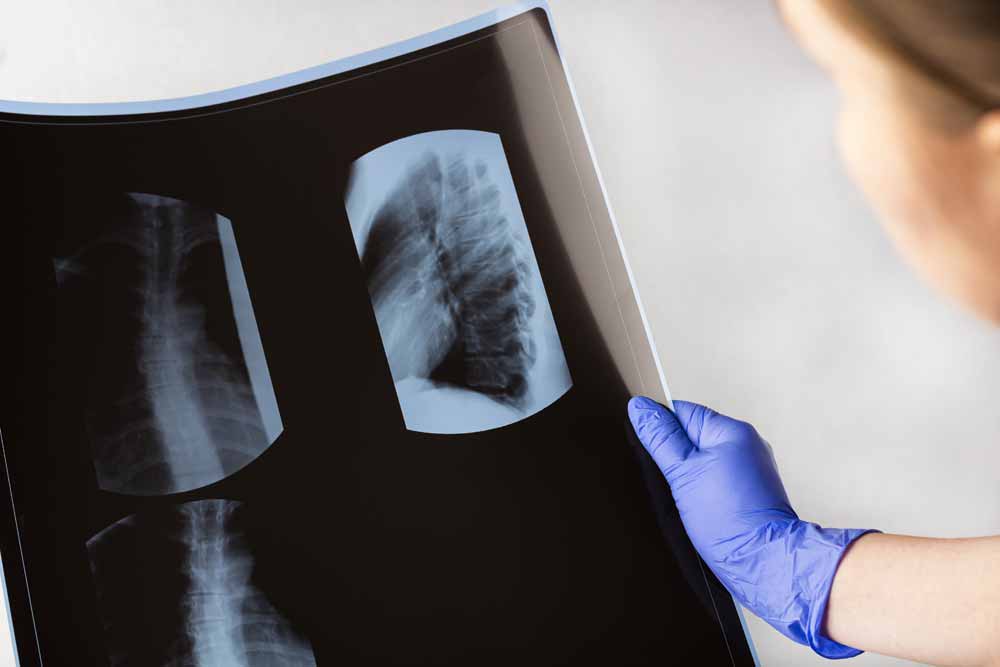
X-ray Heart Borders
According to the radiograph of the chest, the boundaries of the heart are formed: The…

Emergency care of a patient with chest pain – Acute Coronary Syndrome with ST-segment elevation and equivalents /OSCE guide
Opening the consultationWash your hands and don PPE if appropriateIntroduce yourself to the patient including…